
SAP monitoring
SAP monitoring with 367 checks per system.
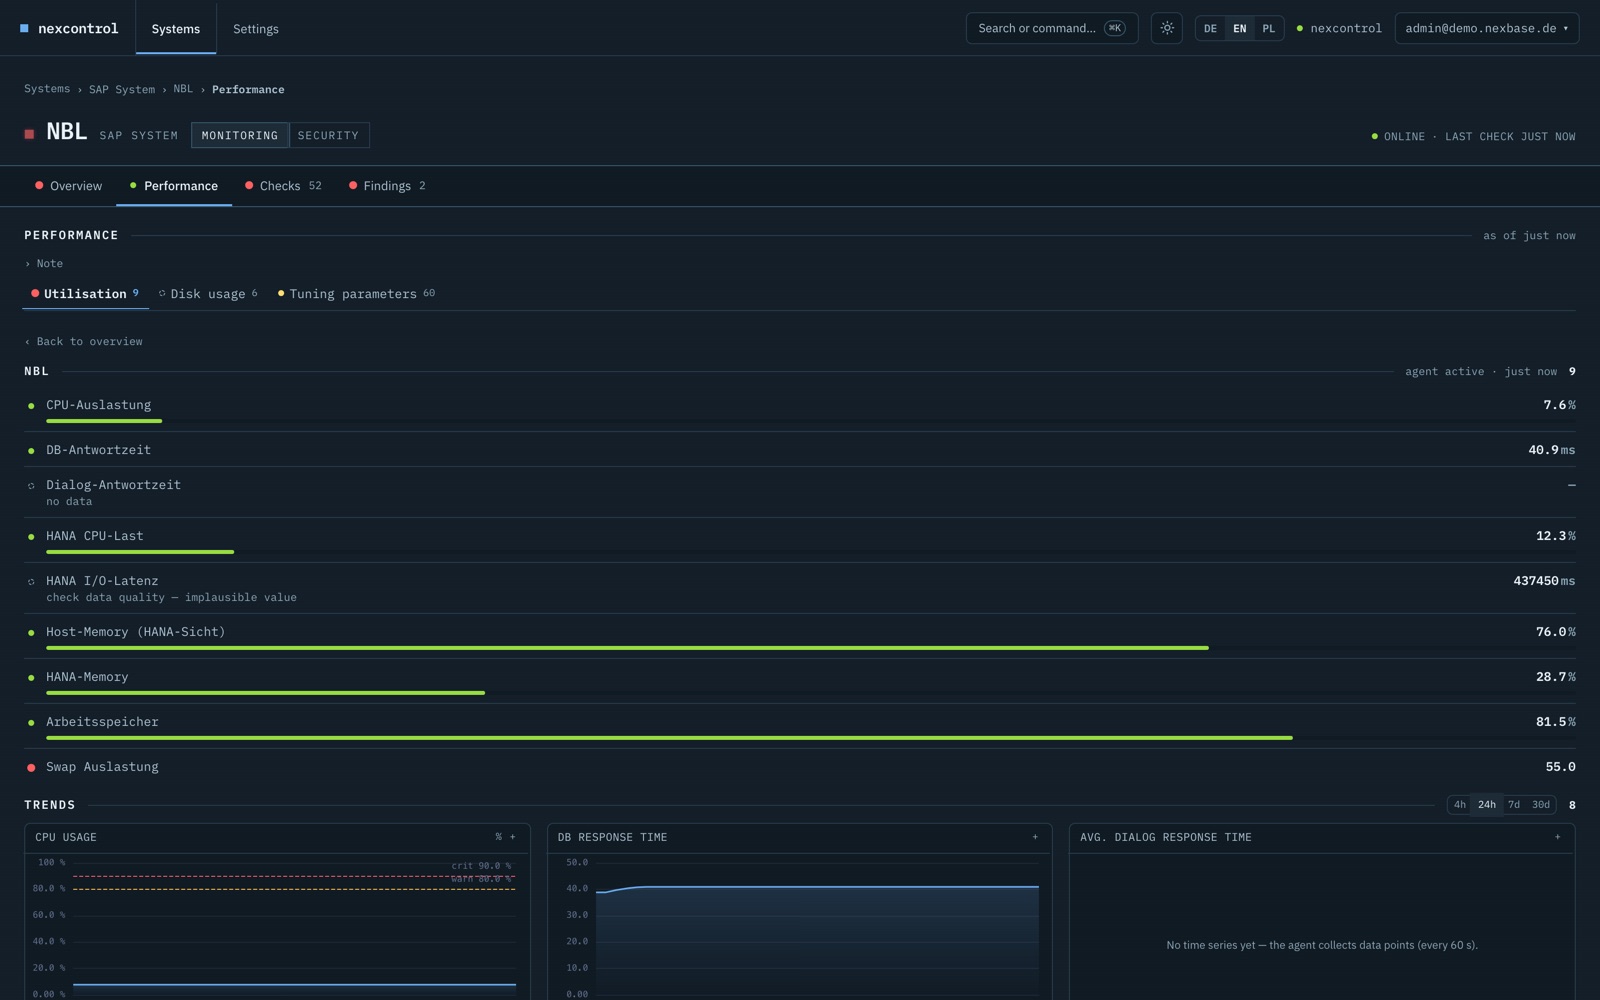
Processes, jobs, backups, response times, HANA memory and interfaces are measured every minute. An alert tells you what is happening and in which system – and the history shows what has been building up for days.
What we measure
From the disk to the response time.
AvailabilityProcesses, instances, RFC reachability, database connection – measured every minute.
Jobs and interfacesCancelled jobs, stuck interfaces, spool and lock problems.
Database and storageHANA memory and backups, disk usage, log volumes, growth over time.
CertificatesExpiry dates of SSL, SNC and signing certificates. The topic is growing: public TLS certificates are being shortened step by step to 47 days by 2029 – without monitoring, one is always about to expire somewhere.
Performance historyCPU, response times and memory as curves over days and weeks – outliers become visible before they reach daily business.
Common questions
Four answers up front.
We already run Solution Manager or Avantra – does that fit?Yes. We keep existing Solution Manager or Avantra setups running – or replace them with NexControl if you want to consolidate.
What happens when an alert fires at night?With agreed on-call coverage, we react. Without it, your team finds the message – by e-mail or Microsoft Teams – first thing in the morning, with the problem and the recommended action.
How long does setup take?About an afternoon: we install the agent and create a read-only user. The first measurements appear after about a minute.
Do you see business data?No. What travels are measurements and configuration states – no table contents and no passwords.

See the monitoring on your own test system.
Half an hour with real data is enough to judge whether the measurements meet your needs. Book a demo →